Algorithmic Trading: Reinforcement Learning in Finance.

“AI/Machine Learning/Deep learning” has become a buzz word in market these days especially with growing interest in retail aspect after the Reddit-GME saga and the recent boom in crypto market.
To give a little preview about myself, my biases leans in favor towards Efficient Market Hypothesis (EMH). This belief of "No arbitrage theory" also aligns with premise behind pricing models like Monte-Carlo simulation, Binomial model and Black-Scholes model which inherits the EMH within themselves.
With prices being considered random and following Geometric Brownian Motion with updrift of risk-free rate, any form of technical analysis is incompatible with the market. In contrary, it is also being acknowledged that the market is not full of rational actors thus there will be misinterpretation of information by investors thus price not reflecting to the information leads to pricing inefficiency.
Over the last 8 months, I have been working on this passion project of mine to take on one of the hardest problem in data science, predicting the stock market.
Predicting the stock Market? No… Not actually. The common goal in every investor was never about predicting stock market. In fact, the end goal was always about maximizing returns.
With this notion, I chose adaptation over prediction. By deploying reinforcement learning resources, I came up with the algorithm that has ability to adjust according to market condition instead of static predictive model. The sole purpose behind this was to incorporate the randomness of prices to the model.
This may sound as an attempt to commit overfitting problem in the model. However, it is an attempt to overfit the validation set and any estimation of path in the model is unbiased of its test performance.
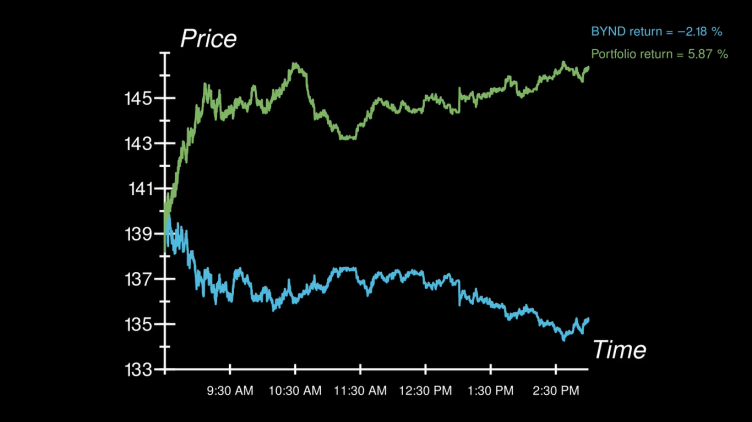
The following is the back-testing result I performed on Jan 20, 2021 data of ticker symbol $BYND. This is based on tick-by-tick data obtained from Bloomberg terminal to avoid any slippage on paper. The portfolio mimics the returns based on trading 1 stock throughout the course. Time along x-axis represents the market hours 8:30 AM to 3:00 PM CST. Total of 6406 execution of trade were made during this period. The returns data were centered to the initial price of stock to visualize with the actual stock price and performance can be compared based on % returns.
In addition, the performance of this model is currently being tested on the live data to test its ability under real-world latency and slippage. The paper results reflects the ideal world of spontaneous execution of trade at targeted price. However, it is determined the returns has tendency to follow its original path regardless of time when the algorithm is being deployed. The significance of difference between paper returns and real-world returns is yet to be determined once larger samples are collected and being analyzed.